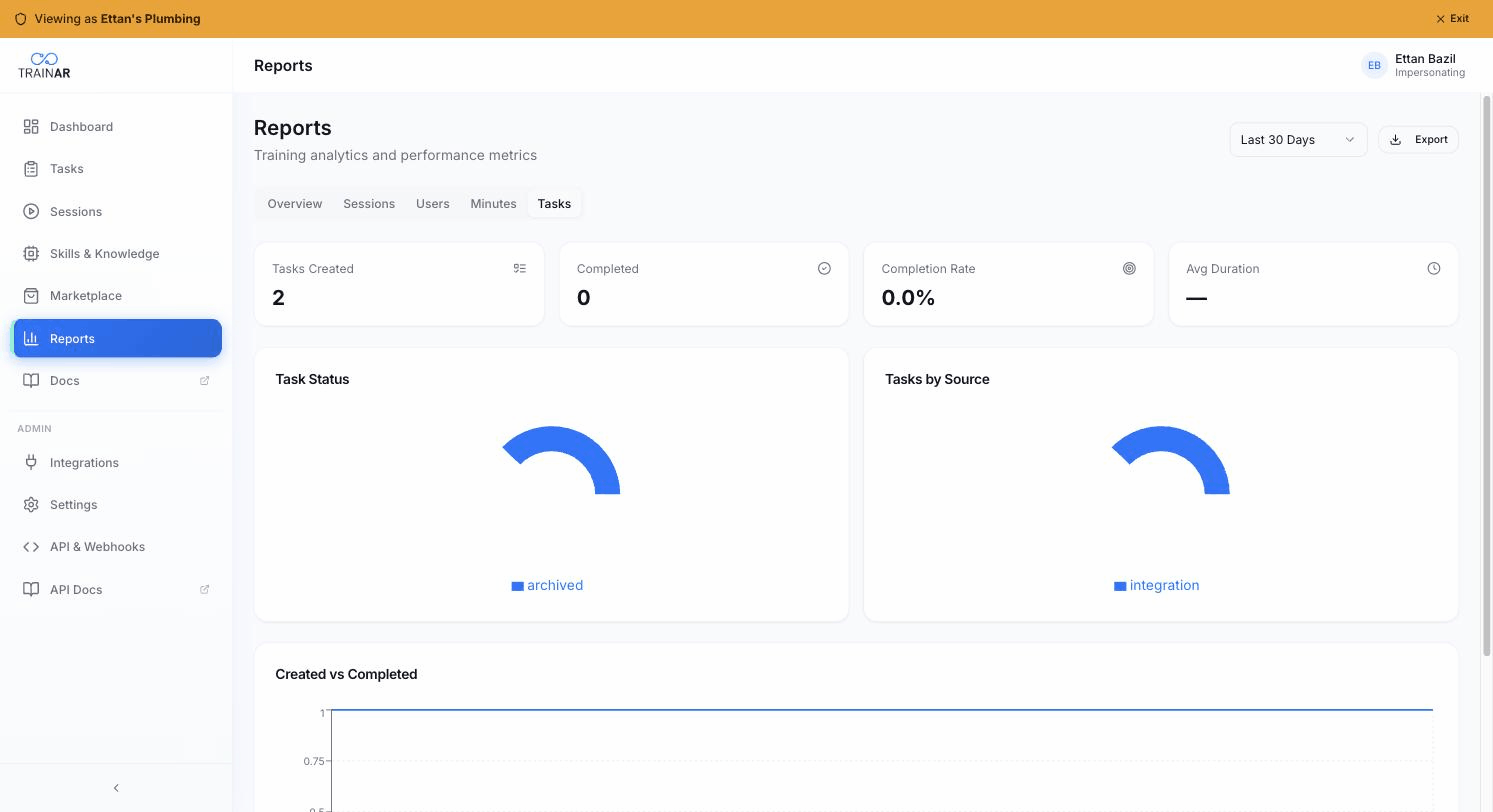
Tasks report
The Tasks tab of Dashboard → Reports shows operational-task throughput — what's getting created, completed, and how the funnel converts.
The Tasks tab of Dashboard → Reports shows operational-task throughput — what's getting created, completed, and how the funnel converts.
What the tab shows
KPI cards (top row)
| KPI | What it is |
|---|---|
| Tasks Created | New tasks created in the selected period |
| Completed | Tasks that moved to status completed in the selected period |
| Completion Rate | Completed ÷ Created × 100 |
| Avg Duration | Average days from task creation to completion (or — if no completions yet) |
Task Status — pie
Pie of the current task statuses across all tasks visible in the period — typically Open, In Progress, Completed, Archived, Cancelled.
Tasks by Source — pie
Where tasks come from: Manual / API / Integration (with per-integration breakdown if multiple). Useful for:
- Confirming your FSM integration is driving the bulk of work
- Spotting if engineers are manually creating tasks that should be coming from the FSM
- Tracking API-created tasks (custom workflows via the TrainAR REST API or n8n/Zapier)
Created vs Completed — line chart
Two lines per day across the selected period:
- Created (blue) — new tasks each day
- Completed (mint) — completions each day
When Completed runs parallel to Created → throughput matches intake. When Completed runs below Created → backlog building. Inverse → backlog clearing.
How tasks relate to sessions
A task can be completed in three ways (the Session badge on the Tasks list reflects which):
- Session ✓ — an engineer ran a TrainAR session against the task and it completed cleanly
- Manual ✓ — an admin marked the task complete from the Dashboard
- Integration ✓ — the source FSM marked the underlying job complete and that synced in
The Completion Rate KPI counts all three sources.
What's NOT here
- No per-engineer task breakdown in this tab (per-engineer activity is on the Users tab)
- No completion-source pie (the Tasks list page filter is the place for that)
- No overdue-tasks chart (look at the Tasks list with status = Open + due date filter)
Where to next
- Reports overview — top-line KPIs
- Managing tasks — the operational tasks surface
- Tasks from integrations — where most tasks come from