Reports overview
Dashboard → Reports is the analytics surface for your account — session activity, minute consumption, user activity, task throughput.
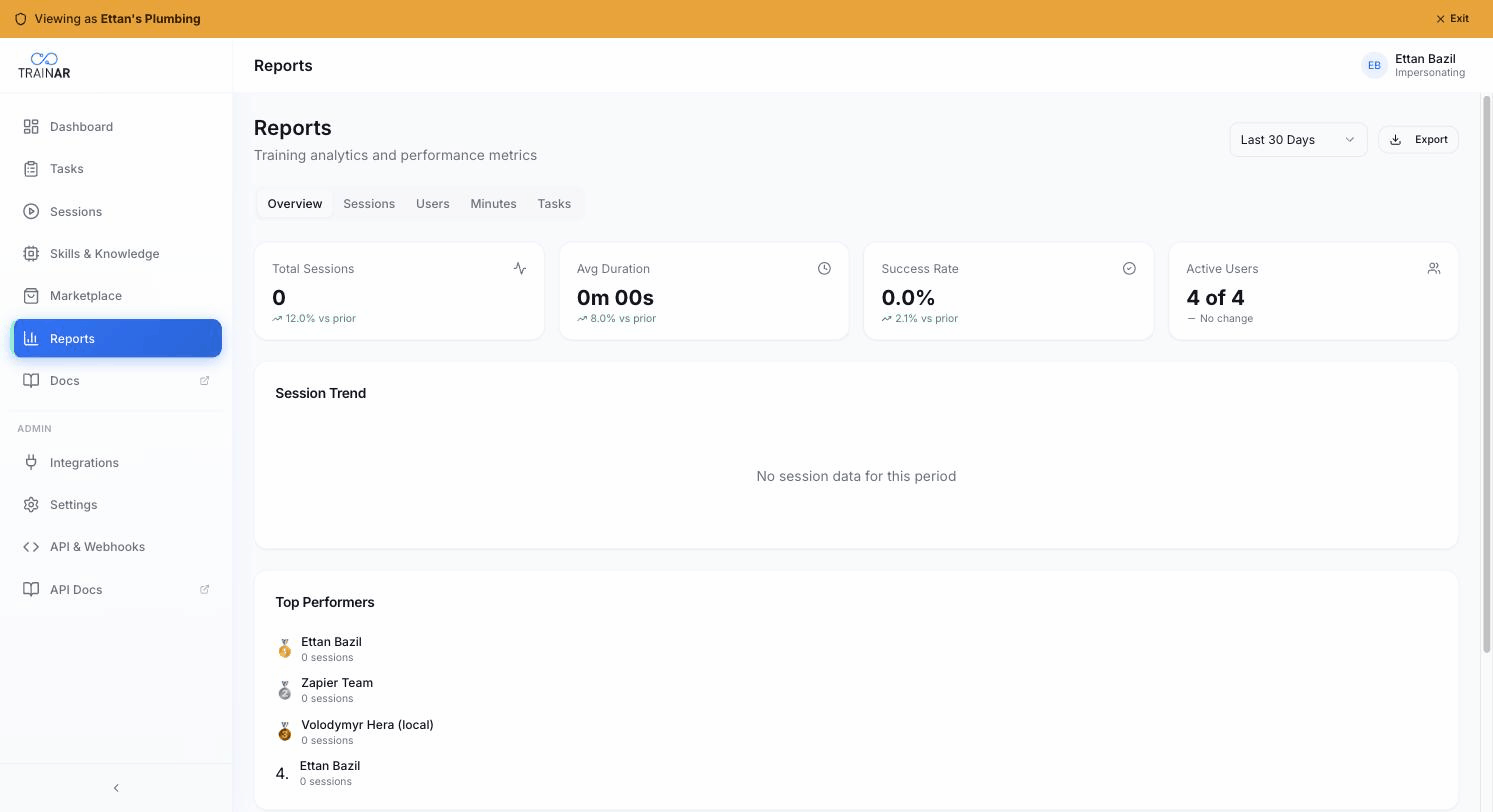
Dashboard → Reports is the analytics surface for your account — session activity, minute consumption, user activity, task throughput. It's a single page with five tabs, a period selector, and an Export dropdown.
The page
At the top right: a period selector and an Export button. These apply to every tab.
Period options:
- Last 7 Days
- Last 30 Days (default)
- Last 90 Days
- This Year
- All Time
There's no custom date-range picker today — pick one of the presets.
The tabs
| Tab | What it covers |
|---|---|
| Overview | Top-line KPIs (Sessions, Avg Duration, Success Rate, Active Users), session-trend line chart, Top Performers (admin only) |
| Sessions | Session-type split, session status, day-of-week pattern, duration distribution |
| Users | Per-user session count (admin gets all users + inactive-users alert; engineers see "My Activity" only) |
| Minutes | Current pool balance, projected runway, usage-over-time area chart |
| Tasks | Tasks-created/completed KPIs, task-status pie, task-source pie, created-vs-completed trend |
Export
The Export button opens a dropdown:
- Export as CSV — opens a section picker; choose any combination of Sessions / Users / Minutes / Tasks. Generates a CSV with the selected slices.
- Export as PDF — coming soon (shows a toast today).
- Export via API — points you at the TrainAR REST API for programmatic export.
CSV exports reflect the current period selection.
What's NOT here
- No custom date ranges (preset periods only)
- No threshold-based alerts in Reports (subscription/billing alerts surface in Settings → Billing automatically)
- No saved report views
- No drill-down from charts (charts are read-only visualisations)
Where to next
- Sessions report — session activity in detail
- Users report — who's running what
- Minutes report — the pool to watch most closely
- Tasks report — task throughput